3.12 Constitutive models for metal single crystals
Plastic
flow in a single crystal is anisotropic, and so cannot be modeled using the
simple constitutive equations described in Section 3.7. Instead, a more complicated constitutive law
is used, which considers the slip activity in the crystal directly. The main
application of the constitutive equation is to model the rotations of
individual grains in a polycrystal, and hence to predict the evolution of texture, and to account for the effects
of texture on the development of anisotropy in the solid.
3.12.1
Review of some important concepts from crystallography
Common crystal structures
Most metal
crystals of practical interest have either face centered cubic, body centered
cubic, or hexagonal crystal structures.
These are illustrated below. Crystal plasticity models exist for all three
crystal structures, but fcc materials are the most extensively studied.

Miller index notation for crystallographic planes and
directions
Planes and directions in a single
crystal are referred to as follows. For
a cubic crystal, we choose basis vectors perpendicular to the faces of the basic cubic
unit cell, as illustrated in the picture.
Then
1. The symbol [l,m,n], where l,m,n are positive
integers, denotes a direction parallel to a unit vector with components
2.
The symbol denotes a direction parallel to the unit
vector with components
3.
The symbol <l,m,n>
denotes the family of [l,m,n]
directions that are identical due to the symmetry of the crystal. For example in a cubic crystal includes all of
.
4.
The symbol denotes a plane that is perpendicular to a
unit vector with components
5.
The symbol denotes a plane that is perpendicular to a
unit vector with components
6.
The symbol denotes the family of (l,m,n) planes that are crystallographically identical by symmetry.
For a
hexagonal crystal, planes and directions are defined by introducing four
auxiliary unit vectors , i=1...4 as shown in the figure above. The first three unit vectors lie in the basal
plane and are oriented parallel to the three shortest distances between
neighboring atoms. The fourth vector is
perpendicular to the basal plane. These
vectors are related to a Cartesian basis by
Then
1.
The symbol [l,m,n,p],
where l,m,n,p are positive integers,
denotes a direction parallel to a unit vector
2.
A bar over one of the indices changes the sign of the index, exactly as for
cubic crystals;
3.
The symbol <l,m,n,p>
denotes the family of [l,m,n,p] directions that are
crystallographically identical by symmetry.
4.
The symbol denotes a plane that is perpendicular to a
unit vector with components
5.
The symbol denotes a plane that is perpendicular to a
unit vector with components
6.
The symbol denotes the family of (l,m,n,p) planes that are crystallographically identical by
symmetry.
Representing crystallographic directions and orientations
using stereographic projections
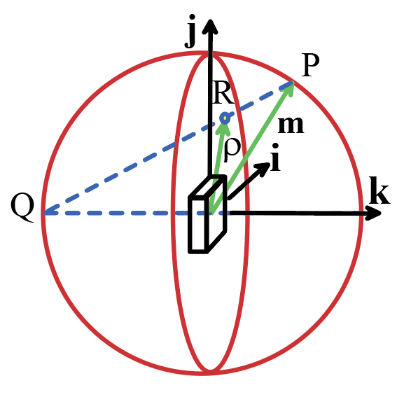 Stereographic
projection is a way to represent 3D orientations on a 2D plane. The figure shows one way to
interpret the projection:
Stereographic
projection is a way to represent 3D orientations on a 2D plane. The figure shows one way to
interpret the projection:
1.
The specimen is placed in the center of an imaginary
sphere with unit radius, with some convenient material directions aligned with
the basis.
2.
A direction of interest is represented by a unit
vector , which
intersects the sphere at some point P on
its surface.
3.
A line is then drawn from P to the point where the k
axis intersects the sphere at Q.
4.
The line PQ cuts through the equatorial plane of the
sphere at some point R
5.
The vector is the stereographic projection of the
orientation m.
6.
The general conversion between the 2D projection and
the 3D unit vector is easily shown to be
7.
The symmetry of the crystal makes the directions equivalent. For this reason, projections usually only
show vectors with a positive k component (the projection of a vector
with a negative k component lies outside the sphere)
Pole figures and inverse pole figures
In crystal
plasticity, the projection is used in two ways. In one approach, specific
crystallographic directions are chosen to be aligned with the directions, and other directions of interest
(which could be other crystallographic directions, or the direction of the
loading axis in a tensile test, for example) are projected. This is known as an
inverse pole figure.
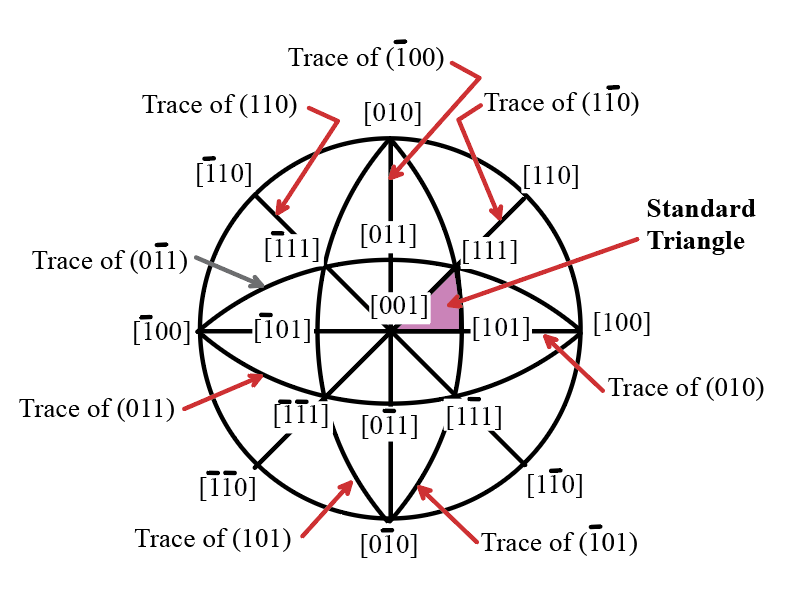
For example,
the figure above shows the standard projection for a cubic crystal. To
interpret the figure, note that
1. The [100],[010] and [001]
directions are parallel to i, j, k, respectively. HEALTH
WARNING: this is not the only choice of crystal orientation you will often see the inverse pole figure
with [100] parallel to k, for example.
2. The points mark the projections of
the specified crystallographic directions.
3. The lines mark the traces of the planes specified: that is
to say, the projection of the line where the plane intersects the surface of
the unit sphere.
4. The figure also shows the standard
triangle for a cubic crystal. Notice
that the traces of the planes divide the plane into a set of 24 curvilinear
triangles, each of which has <100>, <110> and <111>
directions at its corners. These
triangles are indistinguishable because of the symmetry of the crystal you could interchange any two triangles by
applying an appropriate rigid rotation to the crystal, without influencing the
arrangement of atoms. This has
important consequences: for example, when testing the response of a cubic
crystal to uniaxial tension, you only need to run tests with the loading
direction inside the standard triangle.
For this reason, inverse pole figures often only display the standard
triangle.
A second
application of the stereographic projection in crystal plasticity is to display
pole figures. In this approach,
specific physical directions are chosen to be aligned with the basis, and the orientations of
crystallographic directions of interest are displayed on the projection.
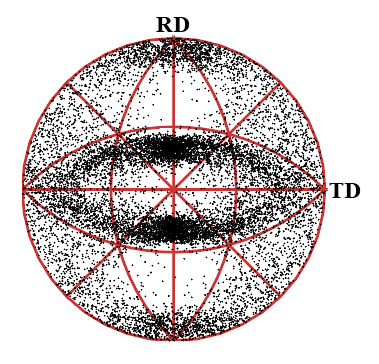 For
example, when a pole figure is plotted for a rolled sheet specimen, the rolling
direction (denoted RD) is often chosen to be parallel to j, the
direction transverse to the rolling direction in the plane of the sheet
(denoted TD) is chosen to be parallel to i, and the direction
perpendicular to the sheet (denoted ND) is chosen to be parallel to k. The sheet generally contains many grains, and
each grain is a single crystal. The
orientations the grains are displayed on a pole figure by choosing some
convenient crystallographic direction (<100> or <111> are common)
and plotting the stereographic projection for each member of this family of
crystallographic directions. In a cubic
crystal, each grain contributes four points to the projection (there are 8
<100> directions but only 4 of them have positive k component).
A typical <100> pole figure for a rolled aluminum sheet after a
40% reduction is shown in the figure. The pole figure shows that grain orientations
tend to cluster together, indicating that the sheet has developed a texture.
For
example, when a pole figure is plotted for a rolled sheet specimen, the rolling
direction (denoted RD) is often chosen to be parallel to j, the
direction transverse to the rolling direction in the plane of the sheet
(denoted TD) is chosen to be parallel to i, and the direction
perpendicular to the sheet (denoted ND) is chosen to be parallel to k. The sheet generally contains many grains, and
each grain is a single crystal. The
orientations the grains are displayed on a pole figure by choosing some
convenient crystallographic direction (<100> or <111> are common)
and plotting the stereographic projection for each member of this family of
crystallographic directions. In a cubic
crystal, each grain contributes four points to the projection (there are 8
<100> directions but only 4 of them have positive k component).
A typical <100> pole figure for a rolled aluminum sheet after a
40% reduction is shown in the figure. The pole figure shows that grain orientations
tend to cluster together, indicating that the sheet has developed a texture.
3.12.2
Features of plastic flow in single crystals
Plastic
flow in a crystal is most often measured by conducting a tensile test with the
loading axis parallel to a chosen crystallographic direction. The main results of these experiments are:
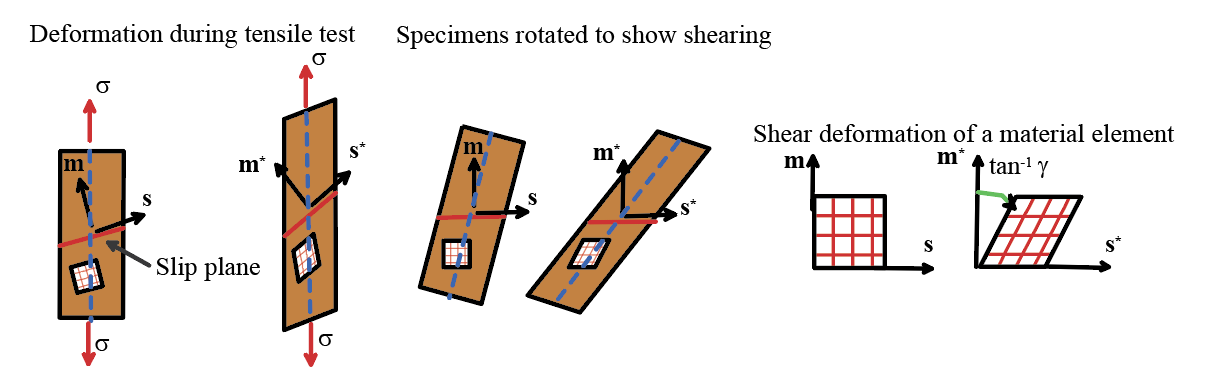
1. For most orientations of the
loading axis, the plastic flow initially consists of shearing parallel to one
member of a family crystallographic planes in the crystal, in the direction of
a vector s lying in that plane, as illustrated in the picture above. The crystallographic plane on which shear
occurs is called a slip plane. The
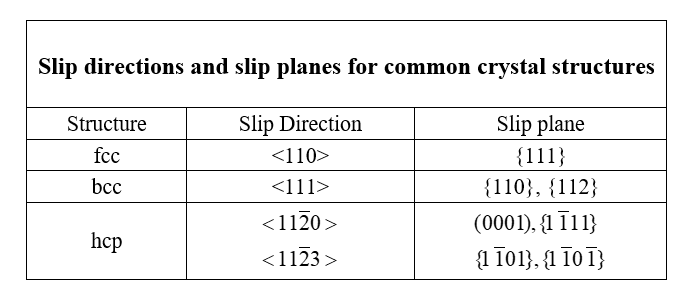
shearing direction is known as the slip Direction. Slip planes and directions for common
crystals are listed in the table below.
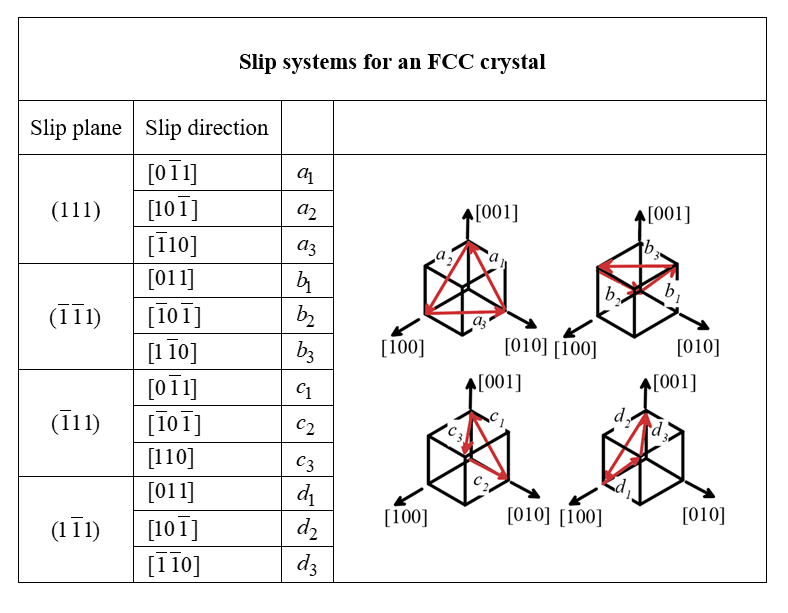
2. Crystals contain a large number of
candidate slip systems. For example, an
fcc crystal contains 12 possible slip systems.
These are conventionally designated as listed in the table below.
3. The slip systems in the undeformed crystal
are identified by unit vectors normal to the slip plane, together with unit
vectors parallel to the slip direction. Here and N
denotes the total number of slip systems (eg N=12 for an fcc crystal).
The crystal can rotate during deformation. In the deformed solid the slip plane normals
and slip directions are denoted , .
4. In a tensile test on an annealed
fcc single crystal, shearing occurs on the slip system that is subjected to the
largest resolved shear stress. The
resolved shear stress on the th
system can be computed from the Cauchy stress acting on the solid as
where
is the
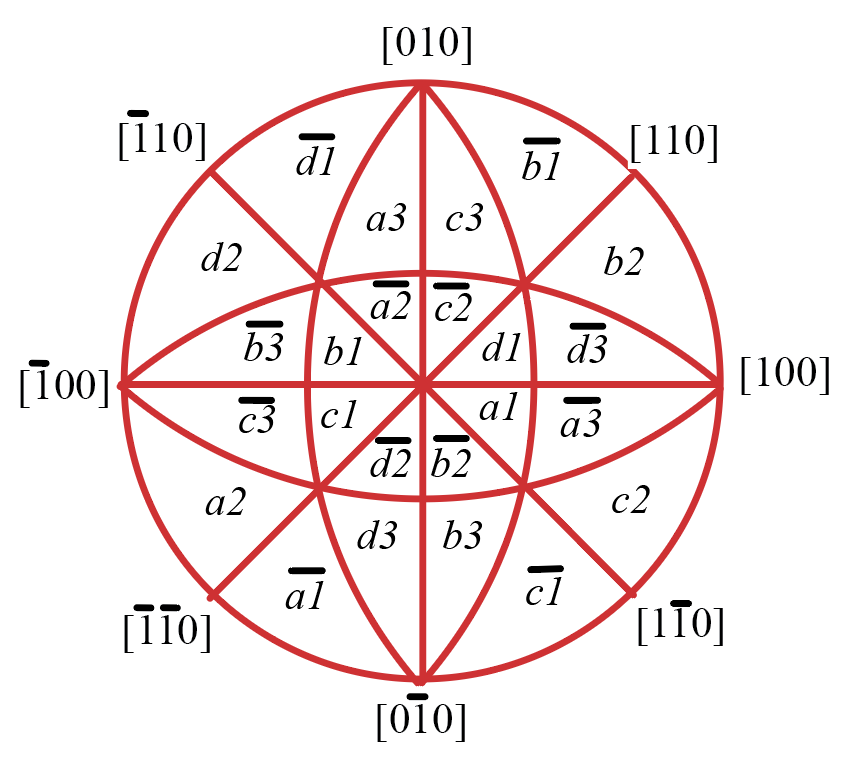
ratio of deformed to undeformed volume of the specimen ( ). For
example, the inverse pole figure below shows
the active slip system for all possible orientations of the tensile axis with
respect to an fcc crystal (a bar over a slip system indicates a negative
resolved shear stress). In materials
with other crystal structures, some slip systems may be inherently stronger
than others. In this case slip occurs on
the system with highest value of , where denotes the strengths of the slip systems
5. Slip on the critical system
initiates when the resolved shear stress exceeds a critical magnitude (the
strength of the slip system) . The strength of the slip systems increases
with plastic straining: this behavior will be discussed in more detail later.
6. For special orientations of the
tensile axis, more than one slip system may be activated. For example, if an fcc crystal is loaded
parallel to a <100> direction, 8 slip systems are subjected to the same
resolved shear stress, and so are active at the same time (the inverse pole
figure below shows the
active systems)
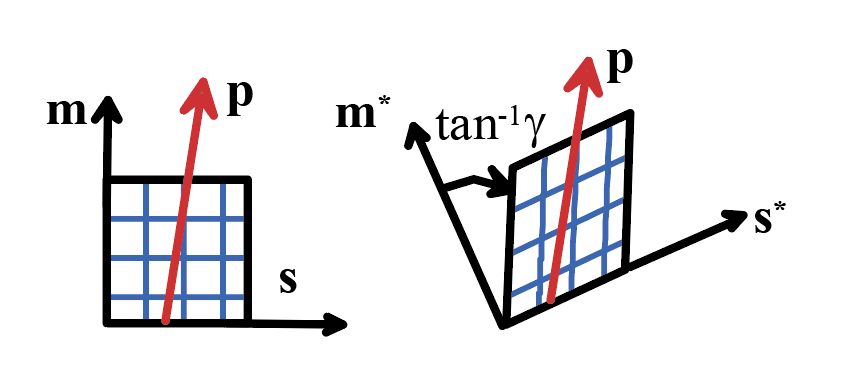
7. The deformation gradient resulting
from a shear strain on the th
system is
where is a proper
orthogonal tensor (i.e. det(R)=1, ),
representing a rigid rotation. The
rotation is determined by the way the solid is loaded. For example, in a tensile test, is often
calculated from the condition that the material fiber parallel to the loading
axis (specified by a unit vector p) does not rotate during deformation,
as shown in the figure below.
This gives
where
and
Other assumptions are also used to calculate R.
8. The crystal lattice is rotated by R, so that after deformation for all the slip systems.
9. The rate of deformation resulting
from a shearing rate on the th
system is
This
can be decomposed into a symmetric part, representing a stretching, together
with a skew part, representing a spin, as
Here,
the first term in represents the rotation of the lattice, while
the second term is the spin due to lattice shearing.
10. 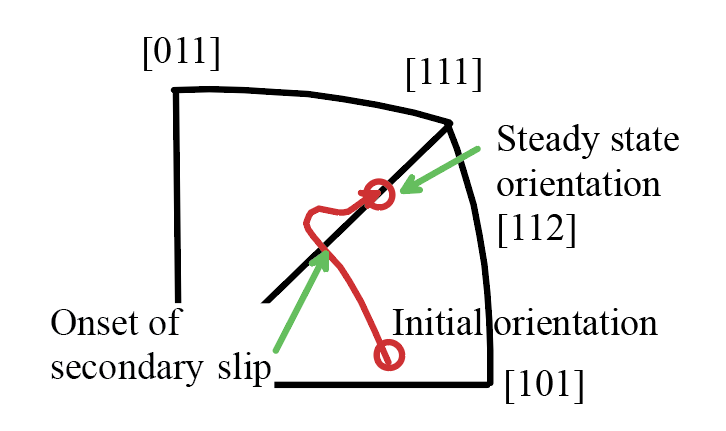 In a
tensile test oriented for single slip, the crystal rotates so as to align the
slip direction with the loading axis.
This rotation is illustrated for an fcc crystal on the inverse pole
figure shown. Eventually, the crystal rotates far enough to
activate a second slip system. The exact
point where this occurs depends on how the crystal hardens; it usually occurs
shortly before the loading axis moves out of the standard triangle. The rotation direction changes after the
second slip system becomes active: eventually, the loading axis aligns with the
[112] direction. This is a stable orientation, and the crystal continues to
deform in double slip without further rotation.
In a
tensile test oriented for single slip, the crystal rotates so as to align the
slip direction with the loading axis.
This rotation is illustrated for an fcc crystal on the inverse pole
figure shown. Eventually, the crystal rotates far enough to
activate a second slip system. The exact
point where this occurs depends on how the crystal hardens; it usually occurs
shortly before the loading axis moves out of the standard triangle. The rotation direction changes after the
second slip system becomes active: eventually, the loading axis aligns with the
[112] direction. This is a stable orientation, and the crystal continues to
deform in double slip without further rotation.
11. 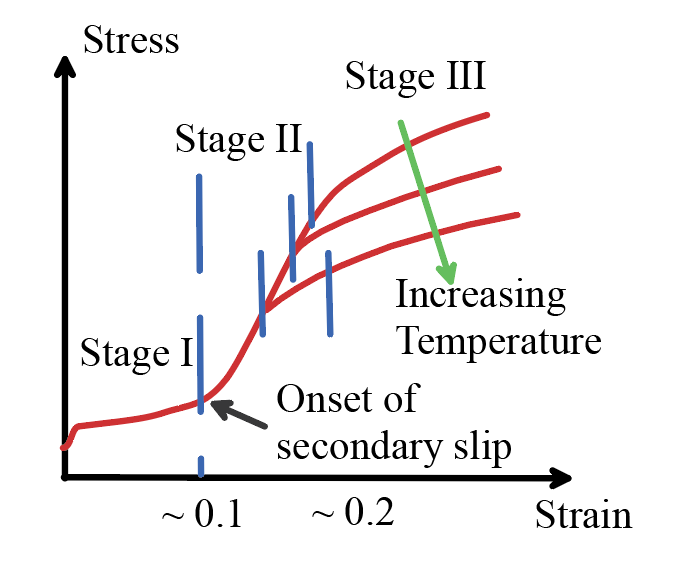 The
resistance of each slip plane to shearing increases with plastic strain, due to
strain hardening. A typical stress-strain curve for a single
crystal that is initially oriented for single slip is illustrated in the
figure. The
curve is divided into three characteristic regions. Stage I corresponds to the
period while a single slip system is active, and has a low hardening rate (resulting
from self hardening); Stage II begins when a second slip system activates, and
has a higher hardening rate (resulting from both self and latent hardening);
while Stage III occurs at large strains, and the hardening rate decreases due
to dynamic recovery. The hardening rates
in Stages I and II are insensitive to temperature; but the Stage III hardening
rate decreases with temperature.
The
resistance of each slip plane to shearing increases with plastic strain, due to
strain hardening. A typical stress-strain curve for a single
crystal that is initially oriented for single slip is illustrated in the
figure. The
curve is divided into three characteristic regions. Stage I corresponds to the
period while a single slip system is active, and has a low hardening rate (resulting
from self hardening); Stage II begins when a second slip system activates, and
has a higher hardening rate (resulting from both self and latent hardening);
while Stage III occurs at large strains, and the hardening rate decreases due
to dynamic recovery. The hardening rates
in Stages I and II are insensitive to temperature; but the Stage III hardening
rate decreases with temperature.
12. Shearing on the th system increases its own strength : this is known as self-hardening. Shearing on the th system also increases the strength of all
the other slip systems , : this is known as latent hardening. Self-hardening can be measured using
single-slip tests. Latent hardening is
often measured by first deforming the material in single slip, then re-loading
the specimen to activate a second slip system.
Latent hardening is often quantified by the Latent Hardening Ratio, which specifies the ratio of the strength
of the second system to that of the first .
The details of the hardening behavior of single crystals are very
complex, and at present there is no consensus on how best to measure or
characterize hardening.
13. Lattice rotation during a tensile
test gives rise to a phenomenon known as `geometric softening,’ which plays an
important role in shear localization in single crystals. The term `geometric softening’ refers to the
fact that the crystal may rotate so as to increase the resolved shear stress on
its active slip system, and therefore lead to a decrease in the tensile flow
stress of the crystal.
3.12.3 Kinematic descriptions used in constitutive
models of single crystals
Let be the position of a material particle in the
undeformed crystal. Suppose that the solid is subjected to a displacement field
, so that the point at moves to , as shown below.
Define
· The deformation gradient and its jacobian
· The velocity gradient
· The stretch rate and spin
· Recall that relates infinitesimal material fibers and in the deformed and undeformed solid,
respectively, as
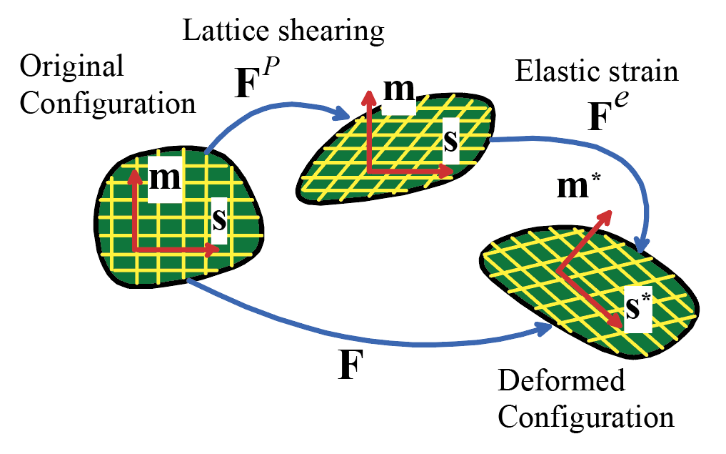
· To decompose the deformation
gradient into elastic and plastic parts, we assume that deformation takes place
in two stages. The plastic strain is
assumed to shear the lattice, without stretching or rotating it. The elastic deformation rotates and stretches
the lattice. We think of these two events occurring in sequence, with the
plastic deformation first, and the stretch and rotation second, giving
· To decompose the velocity
gradient into elastic and plastic parts, note that
Thus the velocity gradient contains two
terms, one of which involves only measures of elastic deformation, while the
other contains measures of plastic deformation.
We use this to decompose L into elastic and plastic parts
· Plastic flow in the crystal
occurs by shearing a set of N slip
systems. The slip systems are
characterized by unit vectors parallel to slip directions and slip plane normals in the undeformed solid. The rate of shear on the th system is denoted by . The velocity gradient due to this shearing is
· It is convenient to define vectors that
describe plastic shearing in the current configuration, as
The former can be interpreted as the slip
direction in the deformed solid (note that it is not a unit vector, however),
while can be interpreted as the slip plane normal in
the deformed solid.
· The plastic part of the velocity gradient
can then be expressed in terms of the shearing rates as
· The elastic and plastic parts of
the velocity gradient can be decomposed in to symmetric and skew symmetric
parts, representing stretching and spin, respectively as
· The plastic stretching and spin
can be expressed in terms of the lattice shearing as
3.12.4 Stress measures used crystal plasticity
Stress measures that appear in descriptions of crystal plasticity are
summarized below:
· The Cauchy (“true”) stress
represents the force per unit deformed area in the solid and is defined by
· Kirchhoff stress
· Material stress for the intermediate
configuration
· Resolved shear stress on a slip
system
· Lattice Jaumann rate of Kirchoff stress
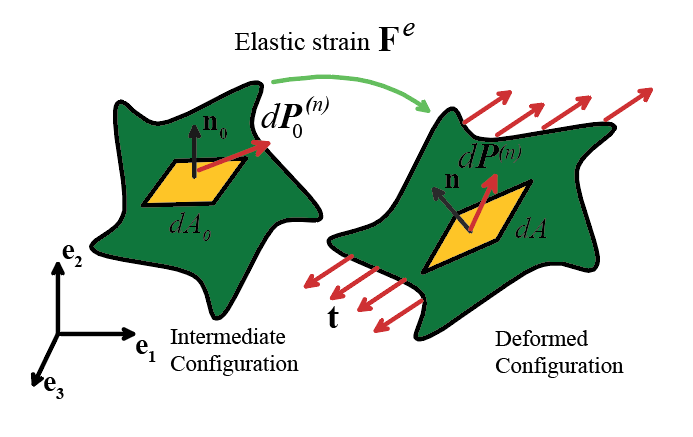 Note that the material stress should
be interpreted as the force per unit area acting on the intermediate
configuration, as shown in the figure, rather than on the undeformed
configuration. See section 3.9 for
further details.
Note that the material stress should
be interpreted as the force per unit area acting on the intermediate
configuration, as shown in the figure, rather than on the undeformed
configuration. See section 3.9 for
further details.
The
constitutive equations must specify relationships between these stress
measures, and the deformation measures outlined in the preceding section. In particular, the constitutive equations
must relate:
1. The elastic part of the deformation
gradient to stress;
2. The rate of shearing on each slip
system to the resolved shear stress.
3.12.5 Elastic stress-strain relation used in crystal
plasticity
The relations
between stress and the elastic part of the deformation gradient follow the
procedure developed for finite strain plasticity in Section 3.9.3. Only the final results will be repeated here
1. Define the Lagrangean elastic strain
as
2. Assume that the material stress is
proportional to Lagrange strain, as , where are the components of the elastic stiffness
tensor (as defined and tabulated in Section 3.2), for the material with
orientation in the undeformed configuration.
3. The elastic stress-strain law is
often expressed in rate form, as follows
where is the Jaumann rate of Kirchhoff stress with
respect to axes that rotate with the crystal lattice; can be thought of as the components of the
elastic compliance tensor for material with orientation in the deformed
configuration, and is the elastic stretch rate.
3.12.6 Plastic stress-strain relation used in crystal
plasticity
The plastic
constitutive equations specify the relationship between the stress on the
crystal and slip rates on each slip system. Here, we outline a simple and widely used
approach to doing this, based on the work of Pierce, Asaro and Needleman
(1983). This model is not the best fit
to experimental observations, however in particular more sophisticated equations are
required to accurately describe latent hardening behavior.
Flow Rule: There are many advantages to using a
viscoplastic flow rule to predict the slip rates in a single crystal: this
avoids having to use an iterative procedure to identify active slip systems,
and also helps to stabilize material behavior.
The simplest such flow rule is
where is the resolved shear stress on the slip
system, is its current strength (which evolves with
plastic straining), and are material properties.
Hardening rule: The hardening rule must specify the
relationship between the slip system strengths and the plastic strain. At time t=0
each slip system has the same initial strength .
Thereafter, the slip systems increase in strength as a result of the
plastic shearing according to
where are strain dependent hardening rates. The hardening rate is approximated as
where are material properties, and is the total accumulated slip on all slip
systems
The matrix controls the latent hardening rate: for an fcc
crystal, it is usually taken to have the form
where q is a material property. The slip systems for an fcc crystal are
listed in Section 3.12.2: for example, slip systems are coplanar, while non-coplanar.
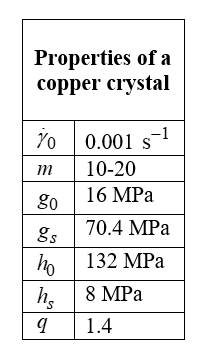
3.12.7 Representative values for plastic properties of single
crystals
Elastic properties of single crystals
are listed in Sections 3.2.15 and 3.2.16. The plastic properties of single
crystals are strongly sensitive to the material’s crystal structure and
composition. For accurate predictions
you will need to test the actual material you plan to use. As a rough guide, representative parameters
for a copper single crystal (taken from Wu, Neale and Van
der Giessen, Int J plasticity, 12,
p.1199, 1996) are listed in the table below.